this was my module 5 assignment
Question 1
A. Null hypothesis: H0: u = 70
Alternative hypothesis: H1: u is not equal to 70
B. z = (69.1 – 70) / (3.5 / sqrt(49)) z = -1.80
Since -1.80 is between -1.96 and 1.96, we fail to reject the null hypothesis. There is not enough evidence that the machine does not meet the specifications.
C. p-value = 0.0719
Since 0.0719 > 0.05, we fail to reject the null hypothesis. There is not enough evidence that the average breaking strength is different from 70 pounds.
D. z = (69.1 – 70) / (1.75 / sqrt (49))
z = -3.60
We reject the null hypothesis. There is enough evidence that the machine does not meet the specifications.
E. z = (69 – 70) / (3.5 / sqrt (49))
z = -2.00
Since -2.00 < -1.96, we reject the null hypothesis. There is enough evidence that the machine does not meet the specifications.
Question 2
x bar = 85
sigma = 8
n = 64
SE = 8 / sqrt(64) = 1
CI = 85 +/- 1.96(1)
CI = 85 +/- 1.96
95% CI = (83.04, 86.96)
Question 3
# Girls data
x1 <- c(4, 5, 6)
x2 <- c(19, 22, 28)
# Boys data
y1 <- c(4, 5, 6)
y2 <- c(18.9, 22.2, 27.8)
# Create data frame
df <- data.frame(x1, x2, y1, y2)
# Correlation
cor(df)
# Pearson correlation
cor(df, method = “pearson”)
# Spearman correlation
cor(df, method = “spearman”)
# Plot of the correlation
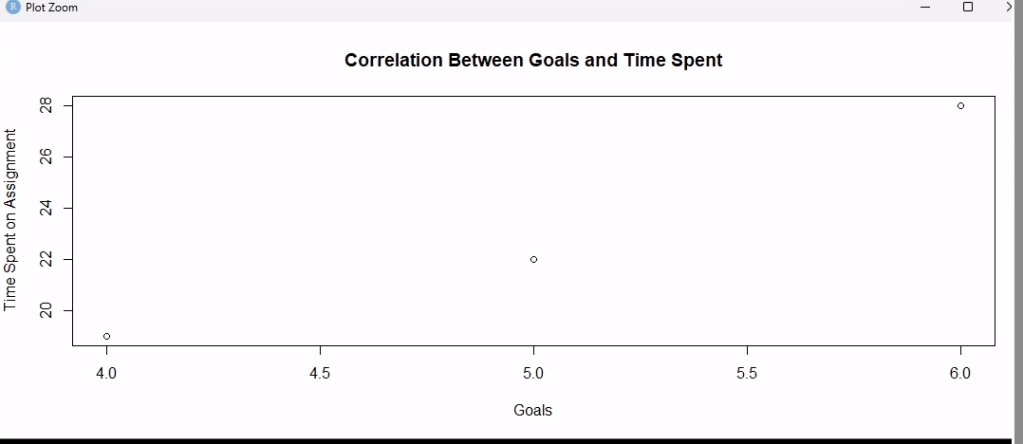
plot(x1, x2, main = “Correlation Between Goals and Time Spent”,
xlab = “Goals”,
ylab = “Time Spent on Assignment”)
# Correlogram
library(corrgram)
corrgram(df)
The Pearson correlation between girls’ goals and time spent on the assignment is 0.982, showing a strong positive relationship and the plot visually represents this.


Leave a comment